

How to Build an NFT Market Dashboard Using QuickNode's GraphQL NFT API
A step-by-step tutorial on building an interactive NFT market dashboard using QuickNode's GraphQL NFT API, React, Next.js, and Tailwind CSS
Actively looking for Smart Contract Developer, DevRel and Technical Writer Role.
ex Smart Contract Developer @Lighthouse | Technical Writer | @QuickNode Ambassador | @chainlink Developer Expert & Community Advocate | Contributor @Developer_DAO, @LearnWeb3DAO and @eden
Built over 70 dapps and published 19 tutorials in web3
Non-fungible tokens (NFTs) are digital assets that represent ownership of a unique item, such as a piece of art or a collectible. With the rise of NFTs, developers are looking for efficient and flexible ways to build applications that leverage the unique properties of NFTs.
But getting all the marketplace data in a consistent manner isn't a simple task; developers have to crawl through the blockchain and filter out the important bits and pieces of data. A tedious and frustrating undertaking.
QuickNode's GraphQL NFT API provides a simple and unified method for developers to interact with NFT marketplaces, regardless of the underlying technology. This tutorial will explain step-by-step how to use this API.
Note: QuickNode recently acquired Icy.tools and we will use the
icy-nft-hookslibrary to access GraphQL NFT API and not call the API directly.

What is QuickNode?
QuickNode is a blockchain platform that provides infrastructure for developers to build and scale decentralized applications (DApps). It offers a suite of tools and services, including a developer API, to make it easier for developers to build, test, and deploy DApps on multiple blockchain networks. QuickNode aims to simplify the building process on blockchain and make it more accessible for developers while also providing high-performance infrastructure to support the growing demand for decentralized applications.
What is QuickNode's GraphQL NFT API?
Sign up for the free GraphQL NFT API!
The GraphQL NFT API is a set of tools and services that allow developers to interact with NFT platforms using the GraphQL query language. This API provides a convenient way for developers to discover, track, and analyze NFTs with real-time floor and volume data, historical charts and trend data, NFT portfolio values on any wallet, and more.
They currently focus on ERC-721 transactions through OpenSea, LooksRare, Genie, gem.xyz, Nifty Gateway, X2Y2, 0x, and CryptoPunks. Multi-chain support is coming soon, along with more marketplaces. The API makes it easier for developers to build applications that leverage the unique properties of NFTs, such as digital scarcity and proof of ownership.
Explore QuickNode Marketplace!
Besides its GraphQL NFT API, QuickNode offers many more tools and solutions for Web3 developers in its marketplace. This includes a gas price estimator, crossmint NFT API, GoPlus anti-fraud API, and a massive library of expert-crafted guides, tutorials, documentation, and other developer resources.
Quickstart with QuickNode API
In this section, we will learn how to build an NFT dashboard using QuickNode's GraphQL NFT API, React, JavaScript, Next.js, and Tailwind CSS. The resulting web application will provide a user-friendly interface that displays real-time NFT market data, such as floor price, sales, average price, volume, and market cap.
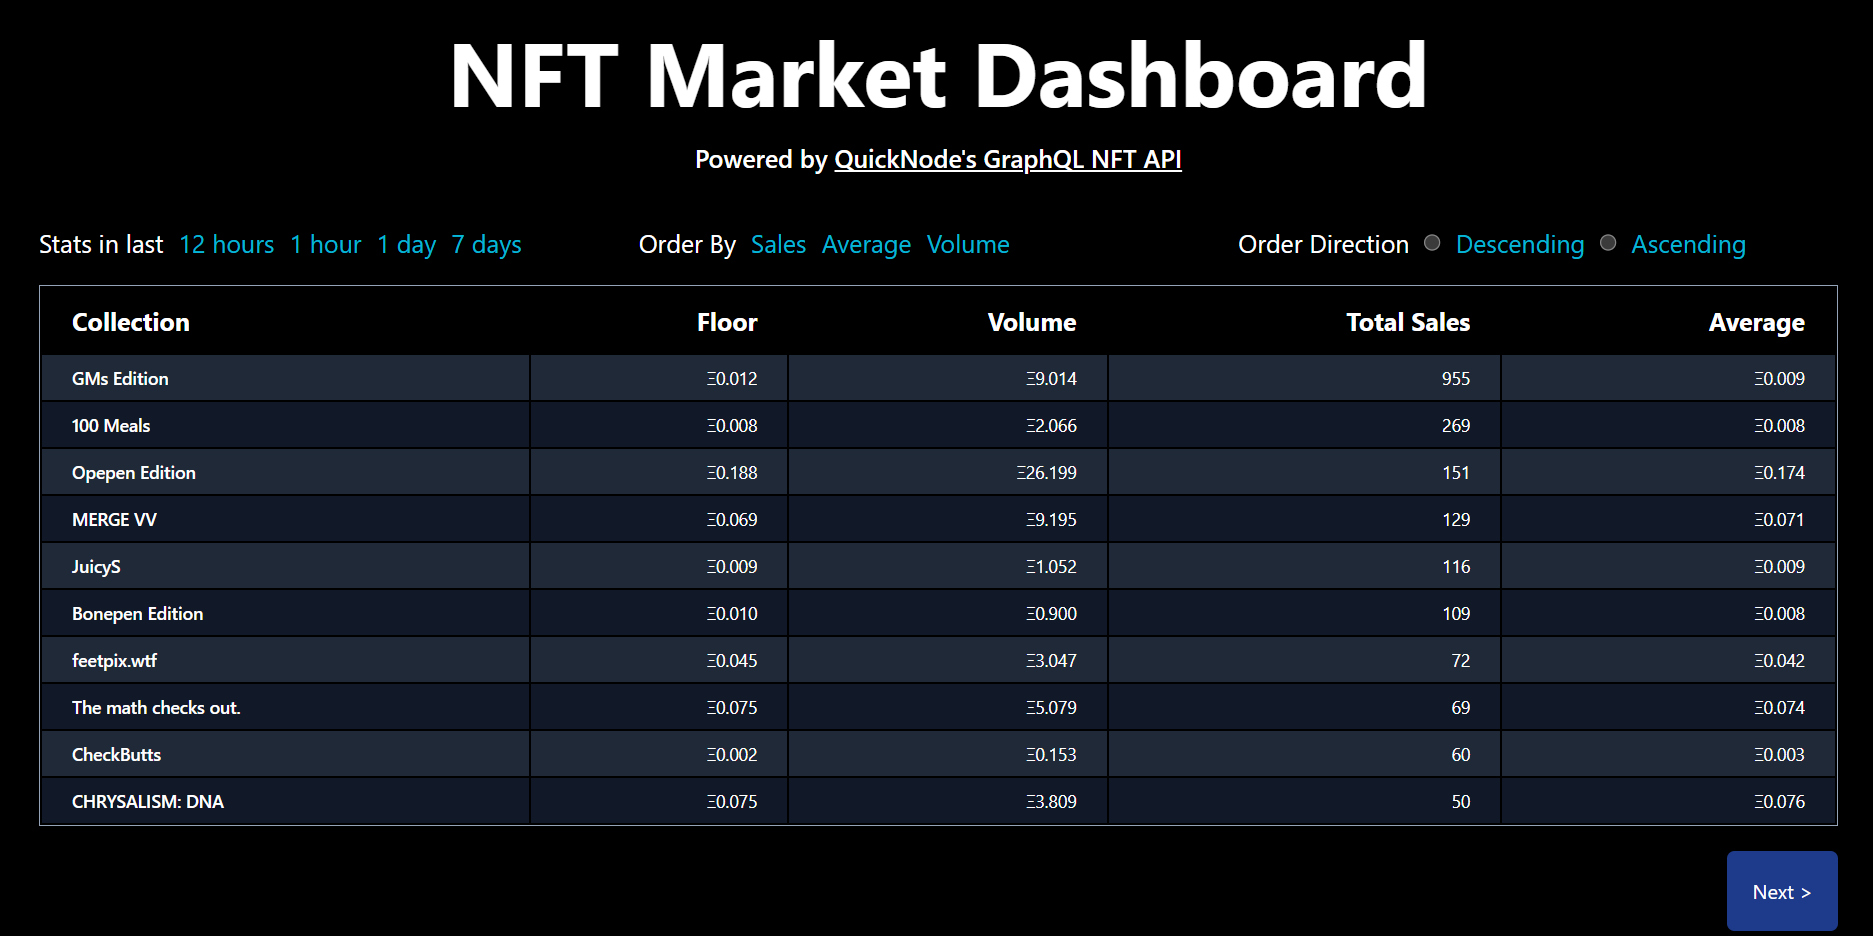
The Functionalities
Users can input various inputs, such as Volume, Floor Price, and Average, in the 'Order By' section.
The app will interact with QuickNode's GraphQL NFT API to retrieve NFT market data.
The app will display the data in a table view.
Users can further filter the output by selecting either ascending or descending order in the 'Order Direction' section.
Users can also select the desired time period, such as the last 1 hour, 12 hours, or one day, for the data.
The Tech Stack
Get started for free on QuickNode!
CSS Framework: Tailwind
API Provider: QuickNode
JavaScript Libraries: Icy-nft-hooks, React
Frontend/Framework: JavaScript, Next.js
The Prerequisites
Have Git, Yarn, TailwindCSS, and Node.js installed on your machine
Basic understanding of JavaScript, React, and TailwindCSS
Step 01: Create a Next.js Project
We will set up our environment and install the necessary dependencies. Open a terminal on your machine and navigate to the directory location where you would like to store your Next.js project. Then, run the following command:
yarn create next-app .
This command creates a new Next.js starter project in the directory specified. Now, start the local development server by running the following command:
yarn dev
The above command sets up your local development environment. Copy and paste http://localhost:3000 into your web browser to launch the Next.js starter project. Here's what your web browser should look like:
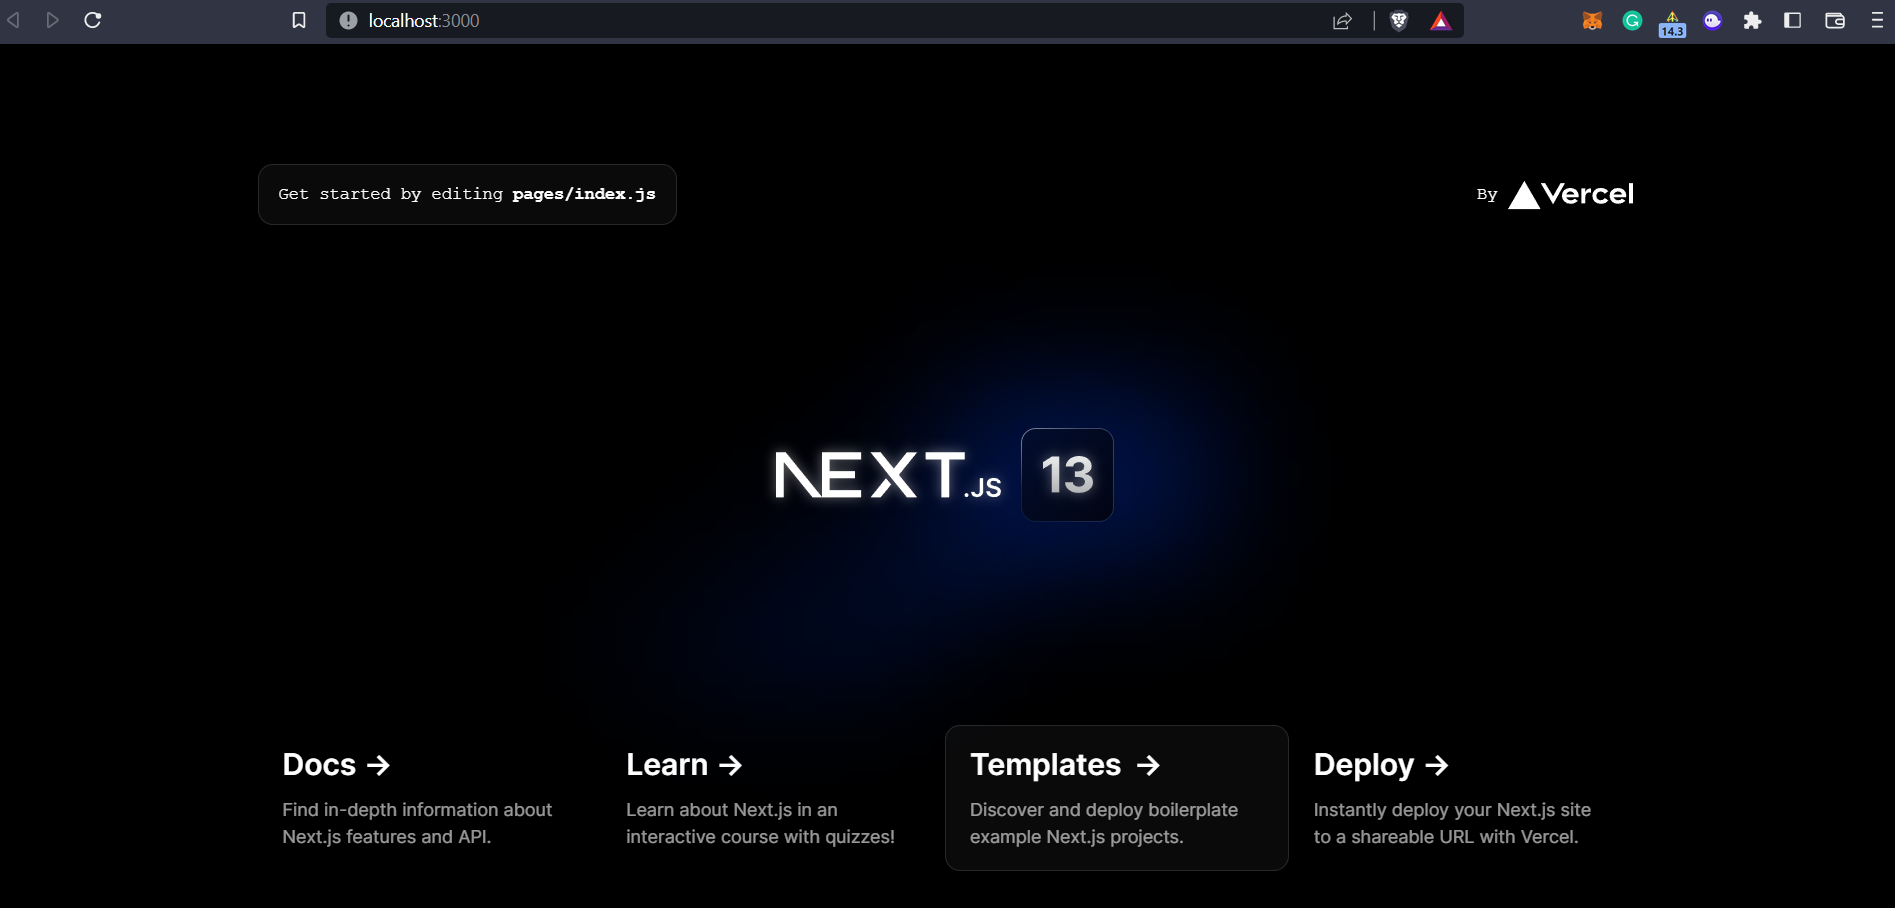
The current app only contains the starter code provided by Next.js, which we will modify throughout this tutorial to create the custom frontend UI for our NFT market dashboard.
Now, let's install Tailwind CSS and its necessary dependencies using npm by running the following command in the terminal:
npm install -D tailwindcss postcss autoprefixer
Run the init command to generate both tailwind.config.js and postcss.config.js files:
npx tailwindcss init -p
In your tailwind.config.js file, add the paths to all your template files by updating the code with the following:
File ./tailwind.config.js
/** @type {import('tailwindcss').Config} */
module.exports = {
  content: [
    "./pages/**/*.{js,ts,jsx,tsx}",
    "./components/**/*.{js,ts,jsx,tsx}",
  ],
  theme: {
    extend: {},
  },
  plugins: [],
}
Now add the @tailwind directives for each of Tailwind's layers to your globals.css file. The top of your globals.css file should look like this:
File ./styles/globals.css
@tailwind base;
@tailwind components;
@tailwind utilities;

...
Step 02: Installing the icy-nft-hooks Library
For creating the NFT market dashboard, we need real-time data, and we will fetch this data using the GraphQL NFT API. We will install and set up icy-nft-hooksa React hook library that acts as a wrapper for the icy.tools GraphQL API. This library enables us to fetch real-time NFT market data, such as the floor price, sales, average price, volume, market cap, etc.
Install the icy-nft-hooks with the following command:
yarn add @quicknode/icy-nft-hooks
yarn add @apollo/client graphql
In the pages directory, navigate to the _app.js file. Copy and paste the following code into _app.js file.
import "../styles/globals.css";
import { IcyProvider } from "@quicknode/icy-nft-hooks";


export default function App({ Component, pageProps }) {
  return (
    <IcyProvider apiKey={QUICKNODE_NFT_API_KEY}>
      <Component {...pageProps} />
    </IcyProvider>
  );
}
We are importing the IcyProvider hook from the icy-nft-hooks package and wrapping the entire web app with the IcyProvider hook.
Step 03: Getting an NFT API Key
As you can see in the above code, we will need an API key to fetch real-time NFT market data. To get the API key, follow these steps:
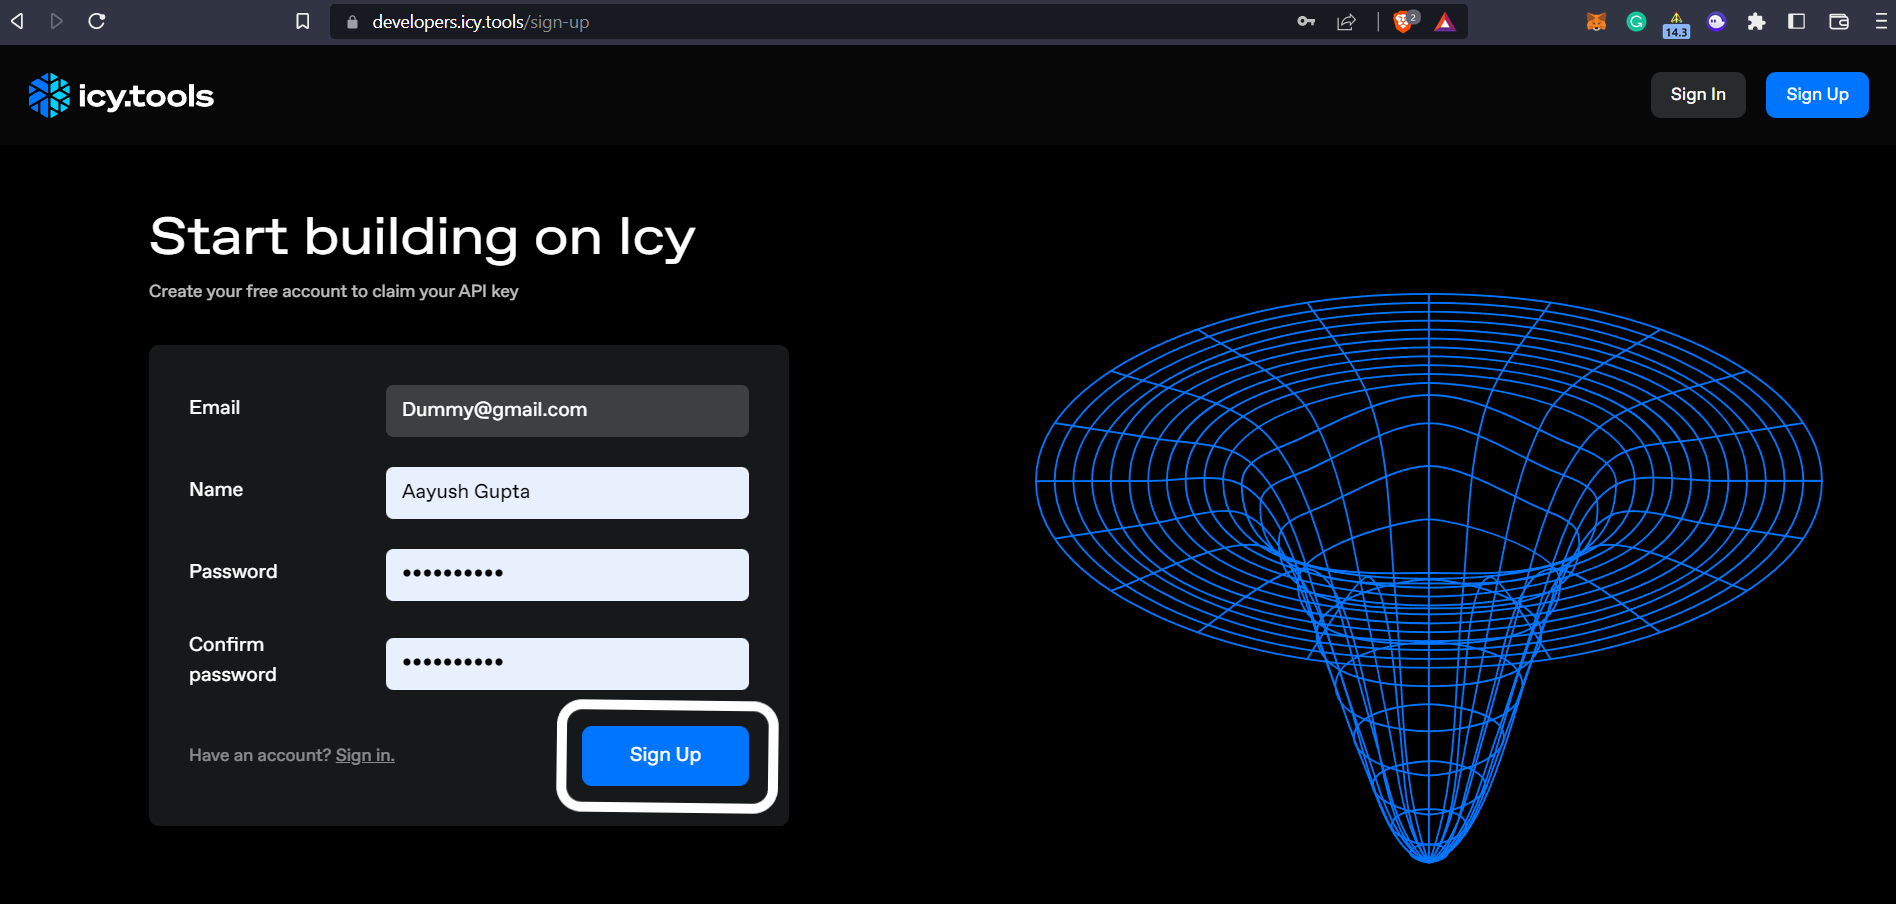
Open Icy tools link and click on the "Sign Up" button.
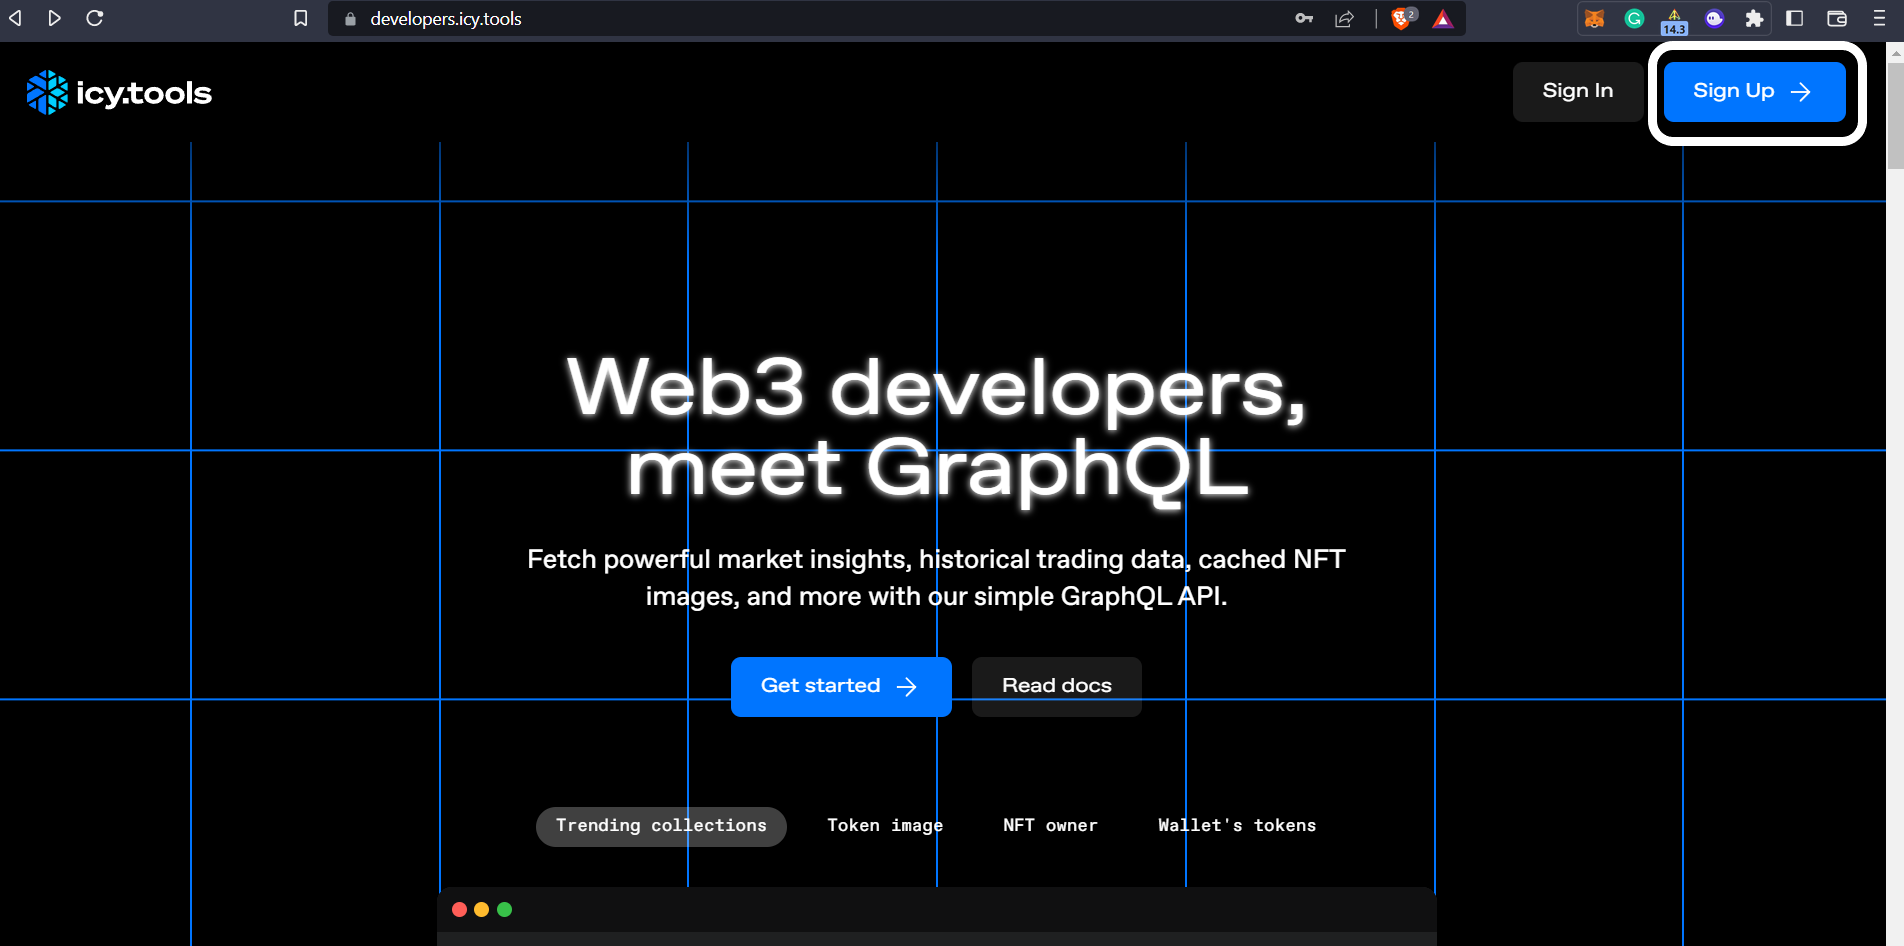
Enter the details and click on the "Sign Up" button
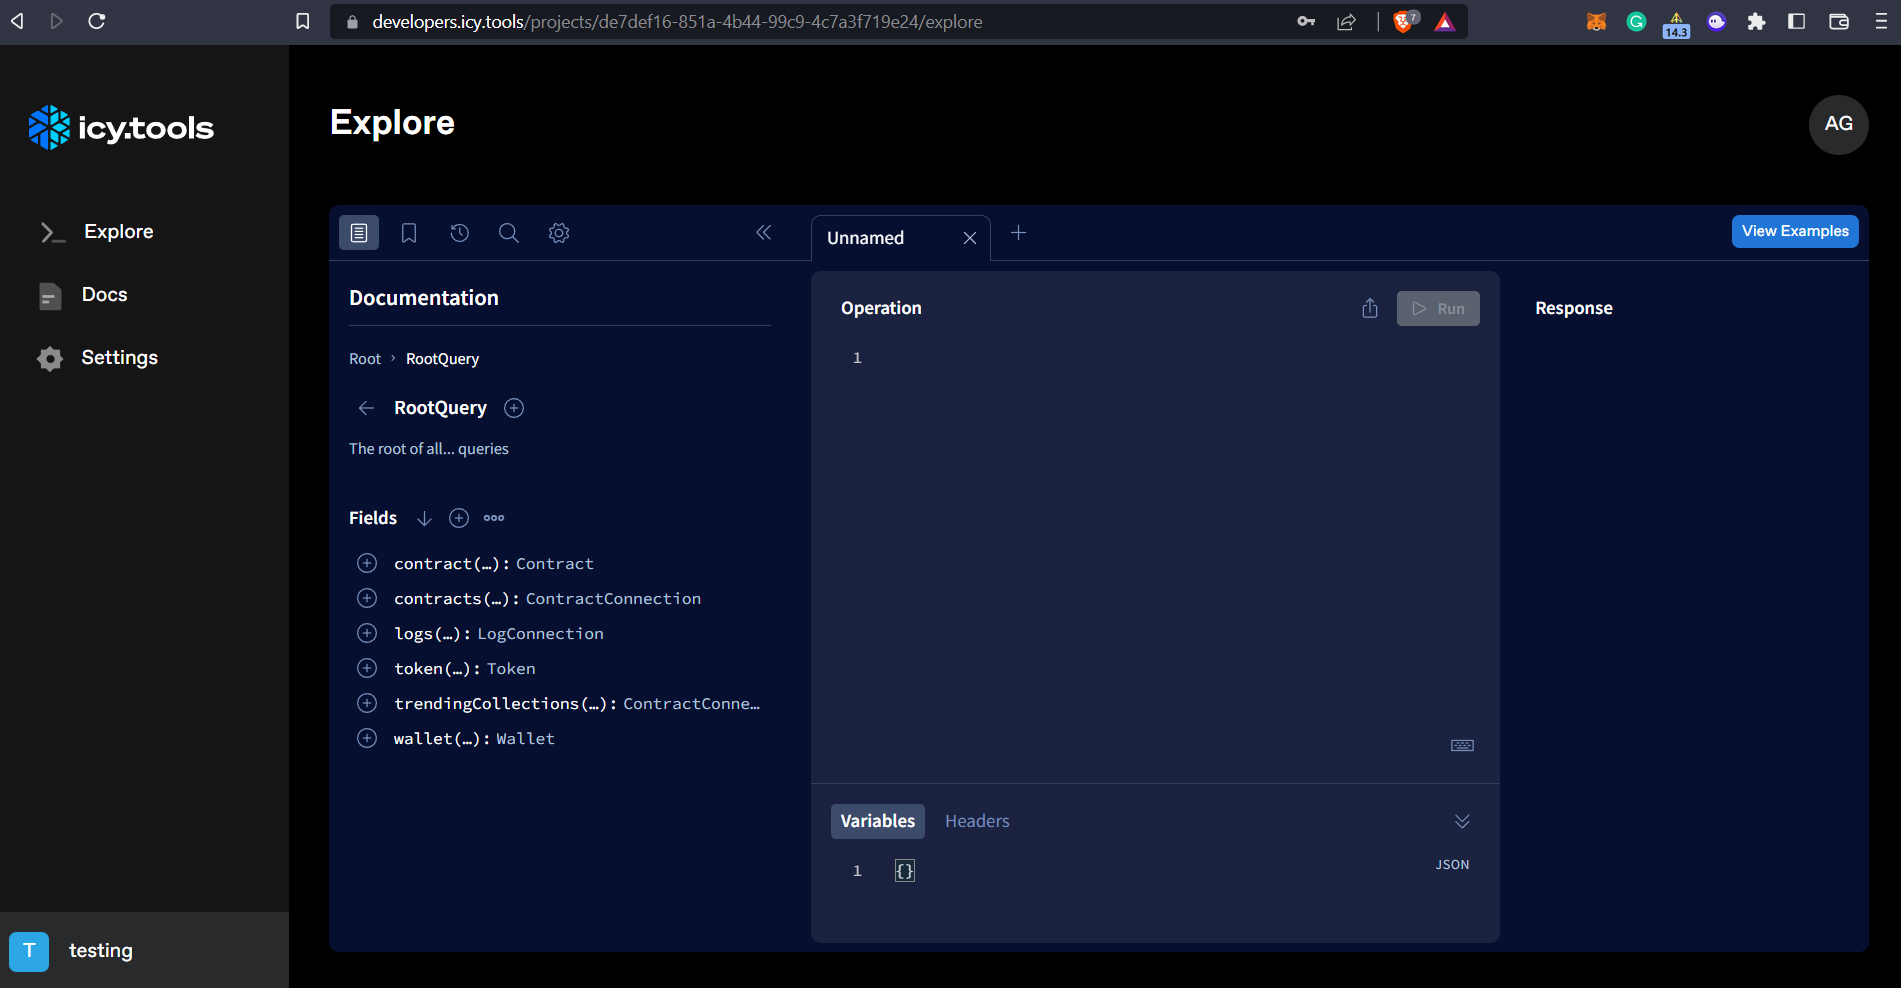
You'll land on the "Explore" page of icy.tools, where you will see something like this:
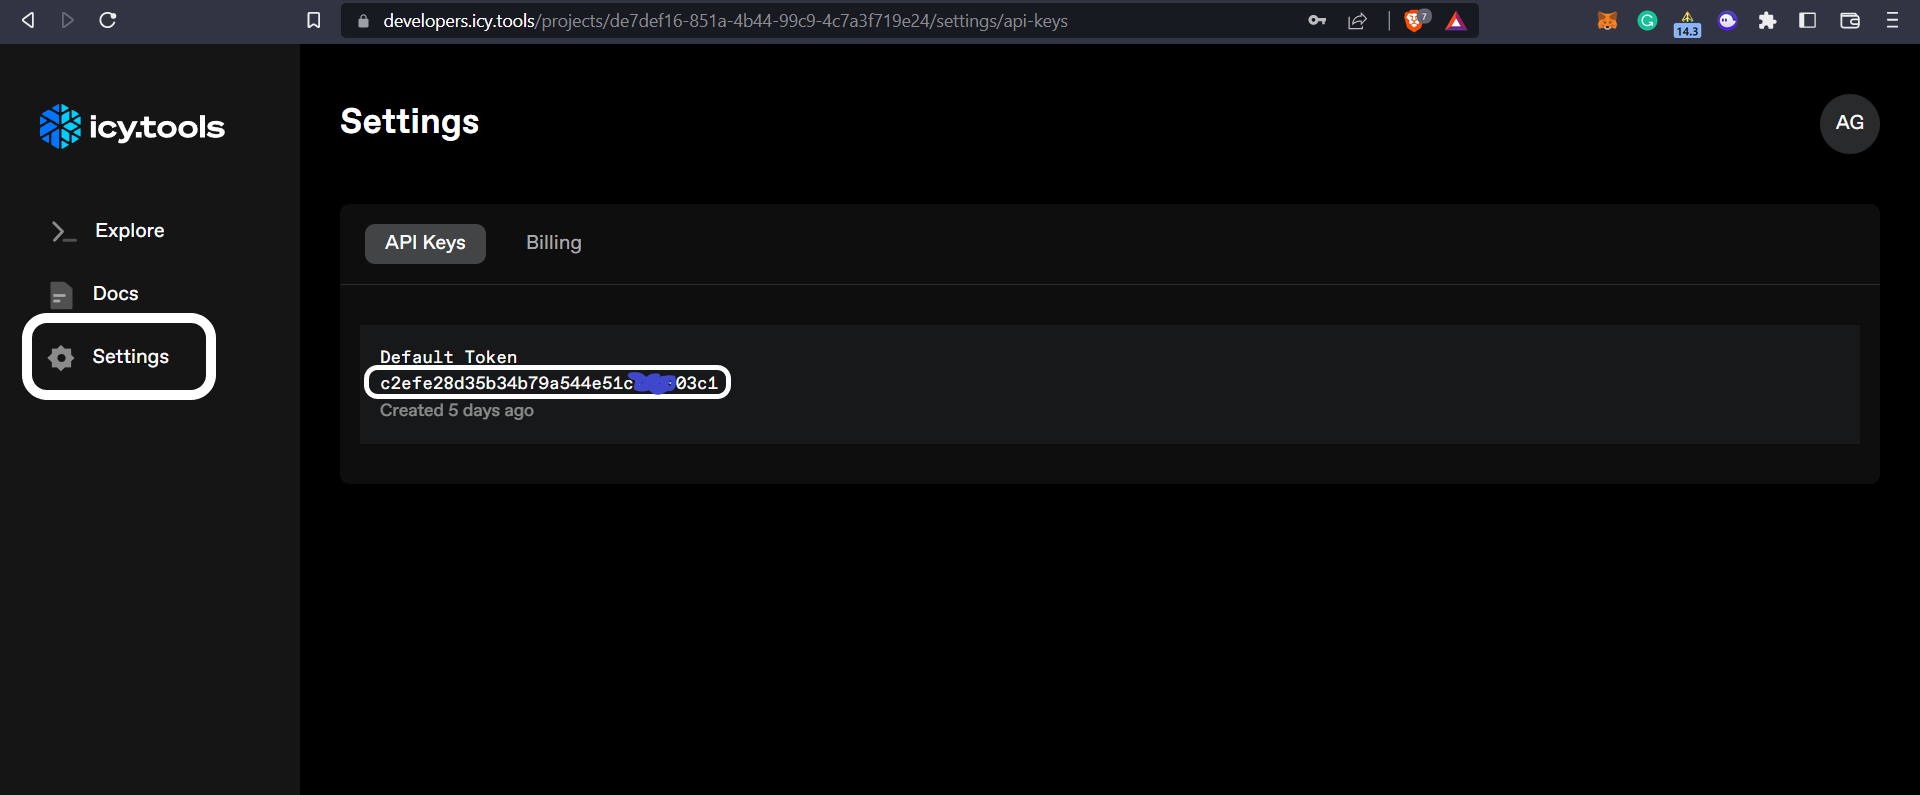
Click on the "Settings" button on the left side. You will see the API key.
Step 04: Installing the dotenv Package
I recommend storing sensitive information, such as API keys, in environment variables instead of hardcoding them in the code. We will use dotenv package for storing sensitive information. Run the following command to install the dotenv package:
yarn add --dev dotenv
Create a .env file in the root folder. Add environment variable
QUICKNODE_NFT_API_KEY = "c34kndhiflmln-API-KEY"
Step 05: Fetching the NFT Market Data
In this section, we'll create the Collections function that accepts various inputs from the user like "Time Period" (1 hour, 12 hours, one day, seven days), "Order by" (Sales, Average, Volume), and "Order Direction" (Descending, Ascending).
icy-nft-hooks provides us with the useTrendingCollections and TrendingCollectionsTimePeriod methods that we will implement and utilize inside of our Collections function.
Create a new file inside the pages directory and name it Collections.js. Please copy and Paste the following code inside it:
File: ./pages/Collections.js
import {
useTrendingCollections,
TrendingCollectionsTimePeriod,
} from "@quicknode/icy-nft-hooks";
import { useState, useEffect } from "react";
function Collections() {
const [cursor, setCursor] = useState("");
const [timePeriod, setTimePeriod] = useState(
TrendingCollectionsTimePeriod.TWELVE_HOURS
);
const [orderBy, setOrderBy] = useState("VOLUME");
const [orderDir, setOrderDir] = useState("DESC");
const { collections, pageInfo } = useTrendingCollections(
{
orderBy: orderBy,
orderDirection: orderDir,
timePeriod: timePeriod,
first: 10,
after: cursor,
}
);
return (
<div className="App bg-black text-white flex flex-col justify-start items-center gap-10">
<div className="w-full h-full flex flex-col justify-start gap-5 items-center">
<h1 className="text-7xl font-bold">
NFT Market Dashboard
</h1>
<h3 className="text-xl font-semibold">
Powered by{" "}
<a
className="underline"
href="https://docs.icy.tools/developer-api/api-reference"
>
QuickNode's GraphQL NFT API
</a>
</h3>
</div>
<div className="w-full h-full flex flex-col justify-evenly items-center">
<div className="w-full h-full flex flex-col sm:flex-row justify-evenly items-center">
<div className="w-full flex justify-start gap-3">
<div className="text-xl">Stats in last</div>
<button
className="text-xl text-cyan-500"
onClick={() =>
setTimePeriod(
TrendingCollectionsTimePeriod.TWELVE_HOURS
)
}
>
12 hours
</button>
<button
className="text-xl text-cyan-500"
onClick={() =>
setTimePeriod(
TrendingCollectionsTimePeriod.ONE_HOUR
)
}
>
1 hour
</button>
<button
className="text-xl text-cyan-500"
onClick={() =>
setTimePeriod(
TrendingCollectionsTimePeriod.ONE_DAY
)
}
>
1 day
</button>
<button
className="text-xl text-cyan-500"
onClick={() =>
setTimePeriod(
TrendingCollectionsTimePeriod.SEVEN_DAYS
)
}
>
7 days
</button>
</div>
<div className="w-full flex justify-start gap-3">
<div className="text-xl">Order By</div>
<button
className="text-xl text-cyan-500"
onClick={() => setOrderBy("SALES")}
>
Sales
</button>
<button
className="text-xl text-cyan-500"
onClick={() => setOrderBy("AVERAGE")}
>
Average
</button>
<button
className="text-xl text-cyan-500"
onClick={() => setOrderBy("VOLUME")}
>
Volume
</button>
</div>
<fieldset className="w-full flex justify-start gap-3">
<div className="text-xl">Order Direction</div>
<input
id="desc"
type="radio"
name="orderDir"
className="text-xl text-blue-600 bg-gray-100 border-gray-300 focus:ring-blue-500 dark:focus:ring-blue-600 dark:ring-offset-gray-700 dark:focus:ring-offset-gray-700 focus:ring-2 dark:bg-gray-600 dark:border-gray-500"
onClick={() => setOrderDir("DESC")}
/>
<label
htmlFor="desc"
className="text-xl text-cyan-500"
>
Descending
</label>
<input
id="asc"
type="radio"
name="orderDir"
className="text-xl text-blue-600 bg-gray-100 border-gray-300 focus:ring-blue-500 dark:focus:ring-blue-600 dark:ring-offset-gray-700 dark:focus:ring-offset-gray-700 focus:ring-2 dark:bg-gray-600 dark:border-gray-500"
onClick={() => setOrderDir("ASC")}
/>
<label
htmlFor="asc"
className="text-xl text-cyan-500"
>
Ascending
</label>
</fieldset>
</div>
<table className="table-auto border-separate border border-slate-400 w-full text-sm text-left text-white my-5">
<thead className="table-header-group text-xl">
<tr className="table-row">
<th
scope="col"
className="table-cell text-left px-6 py-3"
>
Collection
</th>
<th
scope="col"
className="table-cell text-right px-6 py-3"
>
Floor
</th>
<th
scope="col"
className="table-cell text-right px-6 py-3"
>
Volume
</th>
<th
scope="col"
className="table-cell text-right px-6 py-3"
>
Total Sales
</th>
<th
scope="col"
className="table-cell text-right px-6 py-3"
>
Average
</th>
</tr>
</thead>
<tbody>
{collections &&
collections.map((collection) => {
return (
<tr
key={collection.address}
className="table-row odd:bg-gray-800 odd:border-gray-700 even:bg-gray-900 even:border-gray-700"
>
<th
scope="row"
className="table-cell text-left px-6 py-2 font-medium text-white whitespace-nowrap "
>
{collection.name}
</th>
<td className="table-cell text-right px-6 py-2 mono">
Ξ{collection.stats.floor.toFixed(3)}
</td>
<td className="table-cell text-right px-6 py-2 mono">
Ξ{collection.stats.volume.toFixed(3)}
</td>
<td className="table-cell text-right px-6 py-2 mono">
{collection.stats.totalSales}
</td>
<td className="table-cell text-right px-6 py-2 mono">
Ξ
{collection.stats.average.toFixed(3)}
</td>
</tr>
);
})}
</tbody>
</table>
{pageInfo?.hasNextPage && (
<div className="w-full flex items-center justify-end">
<button
onClick={() => {
setCursor(pageInfo.endCursor ?? undefined);
}}
className="rounded-md bg-blue-900 p-5"
>
Next >
</button>
</div>
)}
</div>
</div>
);
}
export default Collections;
If you are curious why we are using values like ONE_HOUR, TWELVE_HOUR, SALES, DESC, AVERAGE etc. Press ctrl + left click on TrendingCollectionsPeriod.
Step 06: Adding Style and Layout
Create a new directory called components in the root, and within it, create a new file called Layout.js. Add the following code inside it:
file: ./components/Layout.js
import React from "react";

const Layout = (props) => {
  const { children } = props;
  return (
    <div className="w-full h-full flex flex-col p-10">
      <div className="w-full h-full flex flex-col">{children}</div>
    </div>
  );
};

export default Layout;
Import the Layout.js inside the _app.js file.
import "../styles/globals.css";
import { IcyProvider } from "@quicknode/icy-nft-hooks";
import Layout from "components/Layout";

export default function App({ Component, pageProps }) {
  return (
    <IcyProvider apiKey={process.env.QUICKNODE_NFT_API_KEY}>
      <Layout>
        <Component {...pageProps} />
      </Layout>
    </IcyProvider>
  );
}
Now navigate to the index.js file and make the following changes:
File: ./pages/index.js
import Head from "next/head";
import Collections from "./Collections";

export default function Home() {
  return (
    <>
      <Head>
        <title> QuickNode Graph NFT API </title>
        <meta name="description" content="Generated by create next app" />
        <meta name="viewport" content="width=device-width, initial-scale=1" />
        <link rel="icon" href="/favicon.ico" />
      </Head>
      <Collections />
    </>
  );
}
Now open the http://localhost:3000 in your browser. You have created an interactive NFT market dashboard.
Full Code Base
GitHub repository of the complete project: NFT Market Dashboard

Additional Resources


